
After 32 years, McDonald’s is ending its sponsorship of the world’s biggest international football tournament when the current deal expires at the end of 2026. It is one of the longest-running commercial partnerships in sport, dating back to 1994.
Most of the coverage has focused on why. We were more interested in what. Eyeballr measured every one of the 104 matches at the 2026 tournament, frame by frame, across every broadcast market. So we know exactly how much screen time McDonald’s got, how many people saw it, and how that compared with every other sponsor in the tournament.
Here is what McDonald’s is walking away from:
Six hours and forty minutes screentime
Across all 104 matches, McDonald’s branding was visible in the broadcast for 6 hours 40 minutes. That is an Eyeballr estimate built from frame-level detection of every pitchside board, screen and sign the cameras caught, averaging 3.8 minutes of exposure per match.
Put that screen time in front of the modelled audience for each match and it adds up to 101.6 billion 30-second-equivalent impressions. Of those, 84.7 billion came through legal broadcast; the remainder is modelled unauthorised viewing. For one brand, in one tournament, that is a lot of eyeballs.
Second in its tier, third among food and drink
McDonald’s sat in the tournament’s second commercial tier, alongside eight other sponsors. On our numbers it finished second of those nine, 12 minutes of screen time behind AB InBev across the whole tournament. A 3% gap, over 104 matches.
It also beat the tier average by a distance: 39% more impressions than the typical Tournament Sponsor, and 15.5% of everything the tier generated between them.
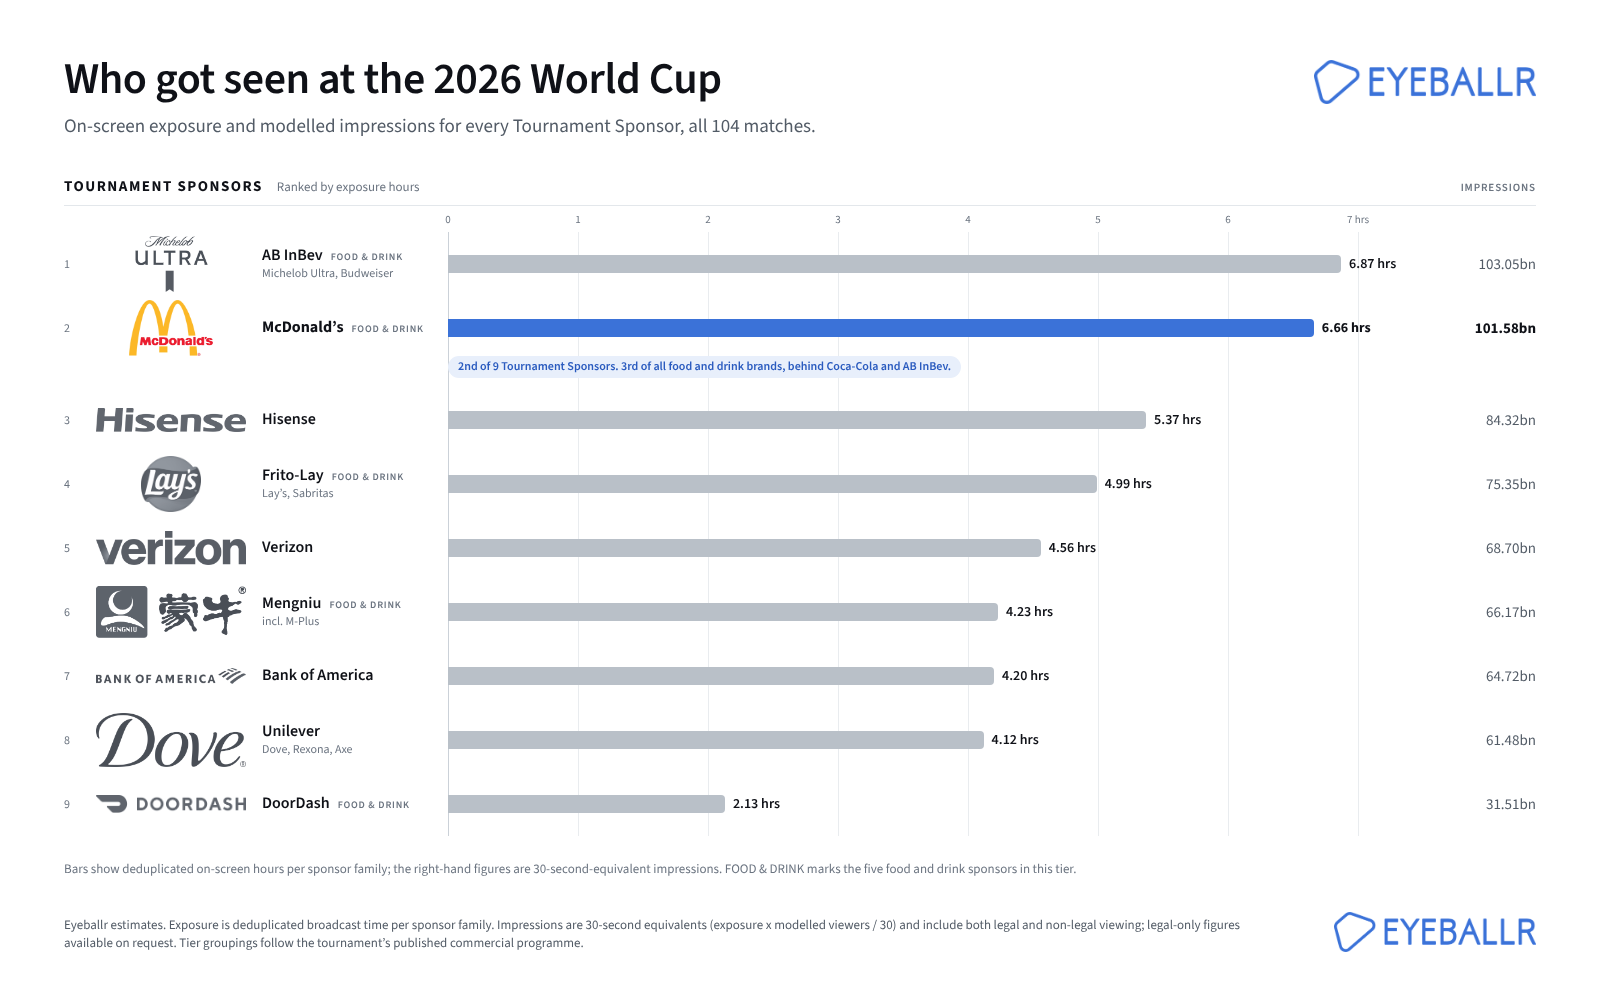
Against the other food and drink brands, McDonald’s ranked third of seven. Only two were ahead of it: Coca-Cola, which sits in the top tier and earned 2.9 times McDonald’s exposure, and AB InBev. Take Coca-Cola out of the picture and McDonald’s accounted for a quarter of all the exposure the remaining food and drink sponsors earned combined.
This was not a brand getting lost in the crowd. It was one of the most efficient second-tier positions in the whole tournament.
The top tier is a different league
The seven Partners at the top of the programme each logged between 14 and 26 hours of screen time. The lowest of them, Hyundai-Kia, still had 2.1 times McDonald’s exposure. Adidas, at the top, had 3.9 times.
That is the structural ceiling on a second-tier deal. McDonald’s did about as well as a tournament sponsor can do, but the inventory simply isn’t there to close the gap to the Partners. Any brand weighing up the vacant slot should go in with that picture clear.
One match was worth 7% of the whole tournament
Exposure didn’t stay flat as the tournament went on. McDonald’s averaged 3.7 minutes per match in the group stage, 4.4 minutes in the quarter-finals and 5.9 minutes in the final. The further the tournament went, the more screen time the brand got, and the bigger the audience watching it.
The final between Spain and Argentina drew a modelled 612.8 million viewers worldwide. McDonald’s 5.9 minutes in front of that crowd produced 7.25 billion impressions (6.28 billion via legal broadcast). One match, 7% of everything the brand earned across the entire tournament.
That is the part of the deal that is hardest to replace. You can buy screen time in plenty of places. You can’t buy 600 million people watching the same thing at the same time.
What the next brand inherits
Somebody will take the quick-service restaurant slot. Whoever it is inherits a position that delivered 3.8 minutes of exposure per match, climbing to nearly 6 in the final, and a modelled 101.6 billion impressions across one tournament. In its tier, only one brand did better.
The open question is whether that performance was down to the slot or down to McDonald’s. Thirty-two years of activation, category exclusivity and a brand that fans already recognise in a fraction of a second all help a logo land. The next partner starts from zero on all three. The inventory will be the same. The outcome may not be.
That is exactly the kind of question Eyeballr exists to answer. In 2030 we will be able to put the new partner’s numbers next to these and say, precisely, what changed.
How we measured this
Every figure in this post is an Eyeballr estimate. We sampled every broadcast of all 104 matches at the tournament and detected brand presence frame by frame. Exposure is the total broadcast time a sponsor family was visible on screen, counted once per moment however many logos appeared. Impressions are 30-second equivalents: exposure seconds multiplied by the modelled audience for each match, divided by 30. Audiences are modelled per market and split between legal broadcast and unauthorised viewing; we report both and never mix them. Tier groupings follow the tournament’s published commercial programme. Our data is not panel-measured or broadcaster-reported, and we don’t present it as such.
No responses yet